Your CI Already Knows What Broke. Let AI Tell You.
16 test failures. 2 root causes. $0.05. Your CI already knows what broke. This workflow makes it tell you.
Krishnanand B
February 10, 2026
A Playwright run fails on your PR. Thirty-four specs, sixteen failures. The CI log is a wall of URL-encoded error annotations, retry markers, and stack traces. You scroll past setup output, browser launch noise, passing tests. You hit Ctrl+F for "Error." Dozens of matches across multiple retries. Some are the same TypeError repeated. Some are timeouts. Some are chunks of HTML that got dumped when something crashed.
You spend twelve minutes reading. The fix is a one-line typo in a selector. The diagnosis took twenty times longer than the repair.
I wanted something that could read those logs and tell me what broke. Not a new product. Not a SaaS subscription. Something I could wire into my GitHub Actions workflow and have it post a summary on the PR.
That's what I built.
What If CI Told You What Broke?
Not a dashboard. Not a Slack notification with a link to raw logs. A summary: "Three tests failed. checkout-flow.spec.ts hit a timeout on the payment button because the aria-label changed from 'Pay now' to 'Complete purchase.' user-profile.spec.ts failed an assertion on the avatar URL. search.spec.ts couldn't find the filter dropdown."
Instead of running npm run test:e2e directly, you ask an AI to run it and summarize the output. Claude Haiku handles this well. Here's the key insight: test failure analysis is reading comprehension, not reasoning. You're not asking the model to architect a solution or debug complex state. You're asking it to read a log and tell you what broke. That's pattern matching. Exactly what cheap, fast models excel at.
It reads the same output you'd read and writes the summary you'd write after twelve minutes of scrolling. In seconds.
The GitHub Actions Workflow
Drop this into .github/workflows/test-analyzer.yml and adjust the test command.
name: E2E Test Analyzer

on:
  pull_request:

permissions:
  contents: read
  pull-requests: write

concurrency:
  group: test-analysis-${{ github.event.pull_request.number }}
  cancel-in-progress: true

jobs:
  test-analysis:
    # Fork PRs don't get access to secrets, so skip to avoid noisy failures.
    # Important: do NOT change the trigger to pull_request_target. That would
    # give fork PRs access to your secrets, which is a serious security risk.
    if: >-
      github.event.pull_request.head.repo.full_name == github.repository
    runs-on: ubuntu-latest
    timeout-minutes: 30
    steps:
      - name: Checkout
        uses: actions/checkout@v4
        with:
          ref: ${{ github.event.pull_request.head.sha }}
          fetch-depth: 1

      - name: Setup Node
        uses: actions/setup-node@v4
        with:
          node-version: 20
          cache: npm

      - name: Install Dependencies
        run: npm ci

      - name: Install Playwright Browsers
        run: npx playwright install --with-deps chromium

      - name: Run Tests via Claude Code
        id: claude
        continue-on-error: true
        uses: anthropics/claude-code-action@v1
        with:
          anthropic_api_key: ${{ secrets.ANTHROPIC_API_KEY }}
          github_token: ${{ github.token }}
          prompt: |
            You are running in GitHub Actions CI.
            Requirements:
            - Do not modify any files.
            - Run the Playwright E2E test suite by executing: npm run test:e2e
            - If tests fail, do not attempt to fix. Summarize the failures
              (which tests, error messages, likely cause).
          claude_args: |
            --model haiku
            --max-turns 6
            --allowedTools "Bash(npm run test:e2e)"
            --allowedTools "Bash(npm run test:e2e*)"
            --allowedTools "Bash(npx playwright test*)"
            --allowedTools "Bash(node -v)"
            --allowedTools "Bash(npm -v)"
            --allowedTools "Read"
            --allowedTools "Glob"
            --allowedTools "Grep"
            --disallowedTools "Edit"
            --disallowedTools "Write"
            --disallowedTools "Replace"
            --disallowedTools "NotebookEditCell"

      - name: Post Test Summary to PR
        if: >-
          !cancelled() &&
          steps.claude.outputs.execution_file
        env:
          GH_TOKEN: ${{ github.token }}
          EXEC_FILE: ${{ steps.claude.outputs.execution_file }}
          PR_NUMBER: ${{ github.event.pull_request.number }}
        run: |
          if [ ! -f "$EXEC_FILE" ]; then
            echo "No execution file found, skipping PR comment."
            exit 0
          fi

          # Extract Claude's final summary from the execution log.
          # The execution file is JSON. The last entry with type "result"
          # contains the summary text. Copy this jq command as-is.
          jq -r '
            [.[] | select(.type == "result")]
            | last | .result // empty
          ' "$EXEC_FILE" > /tmp/test-summary.md

          if [ -s /tmp/test-summary.md ]; then
            gh pr comment "$PR_NUMBER" \
              --body-file /tmp/test-summary.md
          fi
Haiku is more than enough. --model haiku picks Claude's fastest, most affordable model. Summarizing test output is pattern matching, not reasoning. Haiku's sweet spot.
Six turns caps your cost. --max-turns 6 limits API round-trips. The agent needs three: run the tests, read the output, write the analysis. Six leaves a margin.
You choose what the agent can touch. The allowedTools list is a whitelist. The agent can only run your test command and read files. Edit, Write, and Replace are blocked here because I wanted analysis, not changes. More on that below. If you change the test command, update both the prompt and the allowedTools patterns to match.
The comment step runs even on failure. Tests that fail cause the Claude step to exit with a non-zero code. The !cancelled() condition ensures the analysis still gets posted, unless someone cancels the workflow mid-run. The jq command extracts Claude's final output from the execution log and posts it as a PR comment.
Concurrency prevents comment spam. If you push multiple commits quickly, the concurrency block cancels in-progress runs so you get one analysis per push, not five.
A Real Example
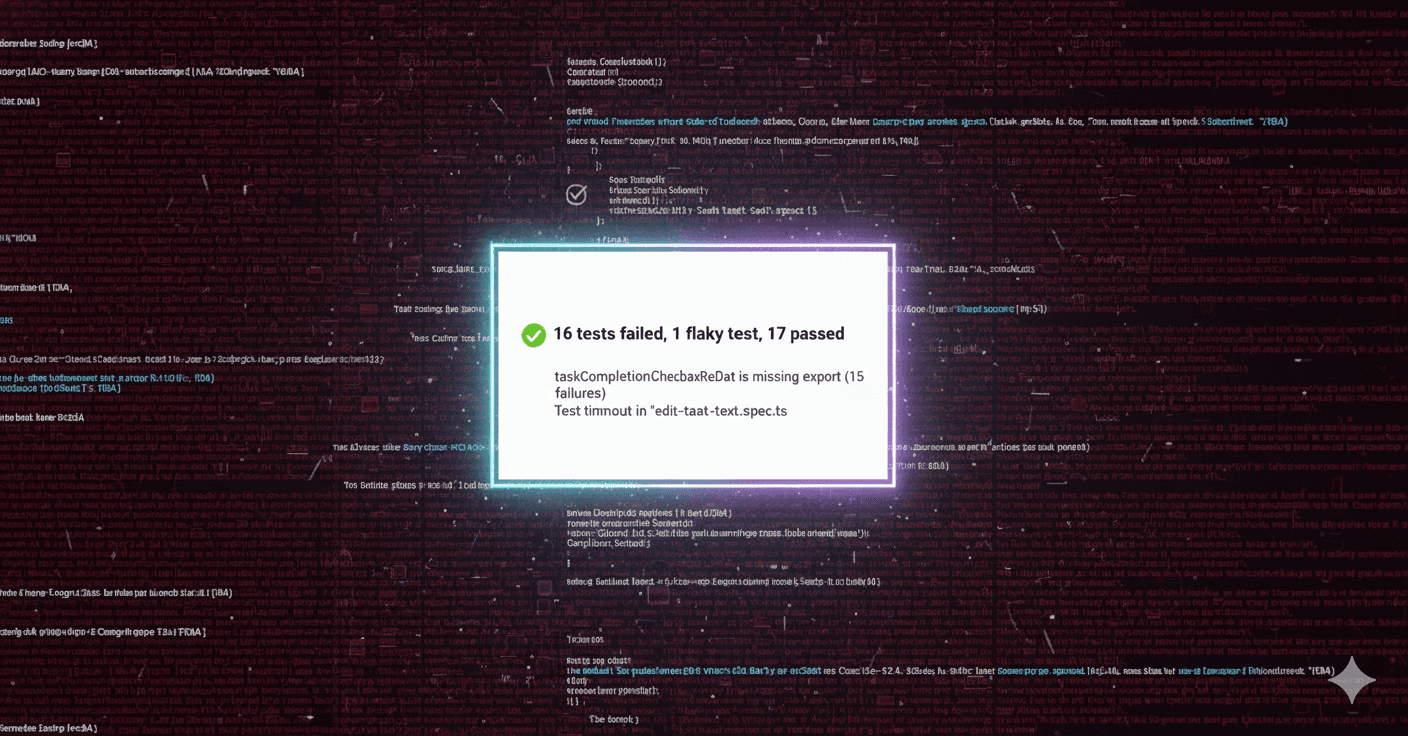
Here's output from a CI run on one of my projects. 34 tests ran, 16 failed, 1 was flaky, 17 passed.
What the raw CI log looks like:
URL-encoded newlines, file paths, retry markers, error annotations, all jammed together:
e/tests/task-management/mark-task-as-complete-with-checkbox.spec.ts:50:51
::error file=e2e/tests/task-management/mark-task-as-complete-with-checkbox.spec.ts,
title=[chromium] › e2e/tests/task-management/mark-task-as-complete-with-checkbox
.spec.ts:30:7 › Mark Task As Complete With Checkbox › user can mark a task as
complete by clicking its checkbox,line=50,col=51::  9) [chromium] ›
e2e/tests/task-management/mark-task-as-complete-with-checkbox.spec.ts:30:7 ›
Mark Task As Complete With Checkbox › user can mark a task as complete by clicking
its checkbox %0A%0A    Retry #2 ─────────────────────────────────────────────────
──────────────────────────────────%0A    TypeError: (0 ,
_components.taskCompletionCheckboxRoleData) is not a function%0A%0A
48 |%0A      49 |     // Act: Click the checkbox to mark the task as complete%0A
> 50 |     await chk.check(taskCompletionCheckboxRoleData(taskName),
{ force: true });%0A         |                                                   ^
That's one failure. There were sixteen. Each with retries. You'd scroll through pages of this.
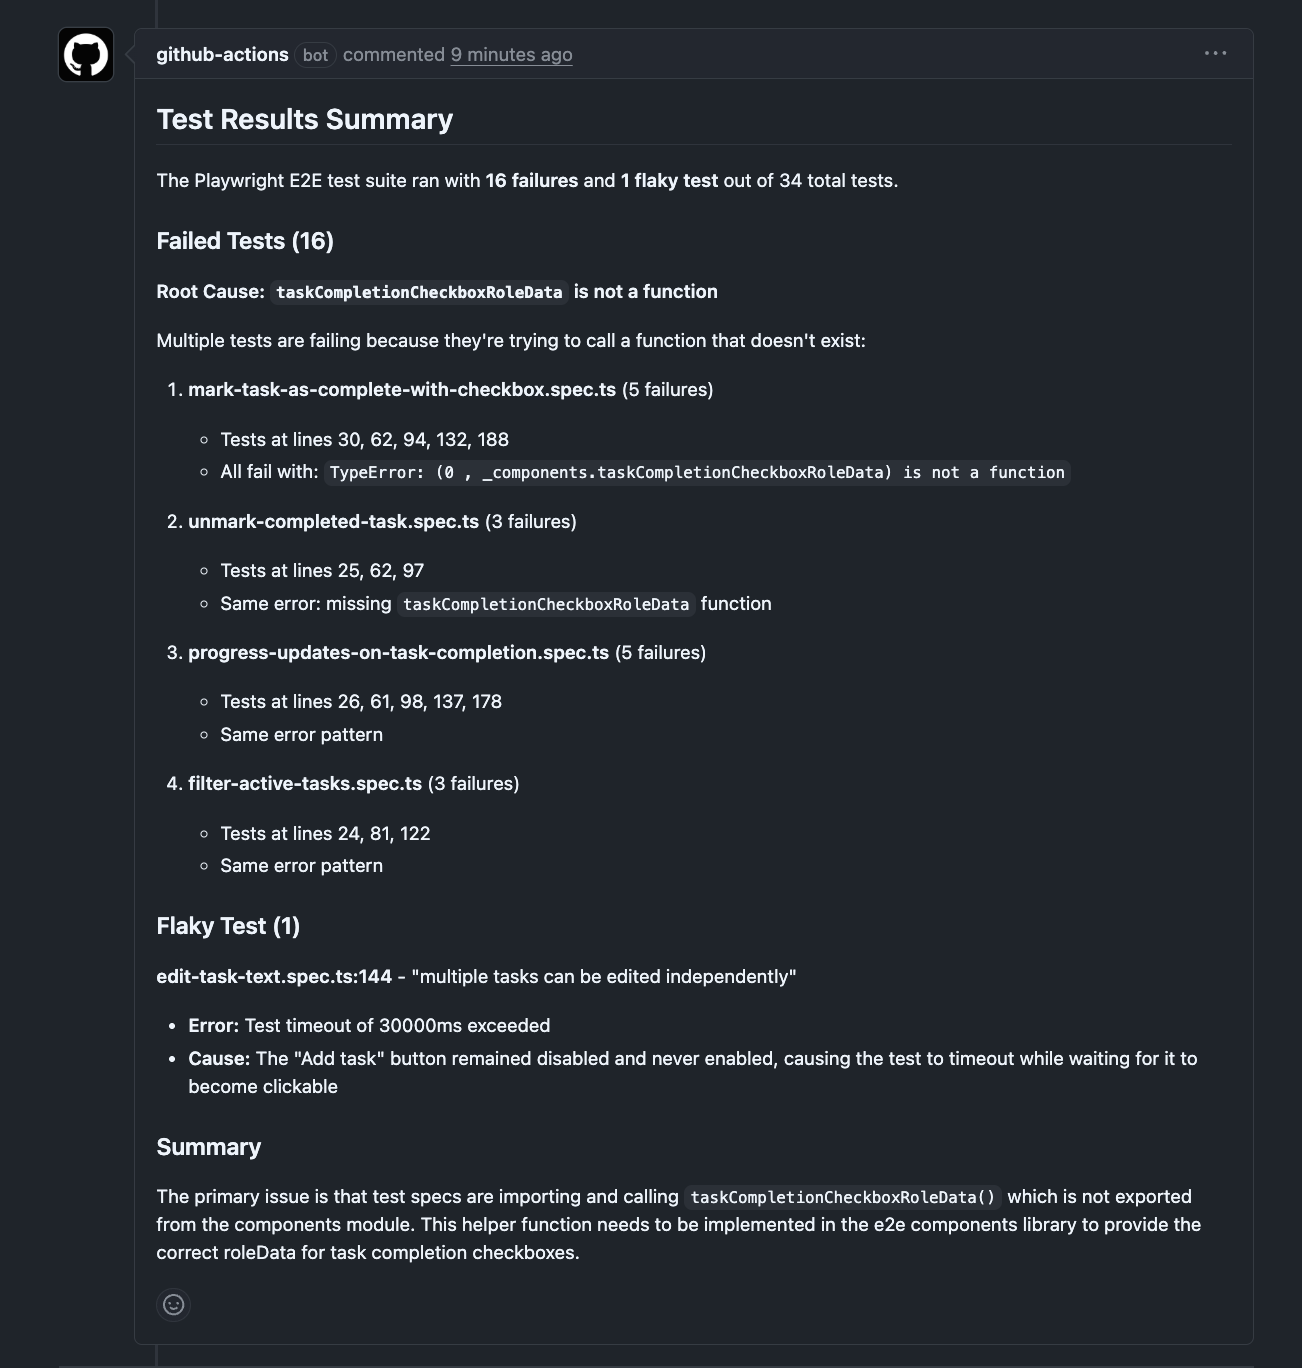
Compare that to what Claude produced from the exact same run:
16 tests failed, 1 flaky test, 17 passed
The failures fall into two categories:
1.
taskCompletionCheckboxRoleDatais not a function (15 failures)This affects multiple test files:
mark-task-as-complete-with-checkbox.spec.ts(5 tests)unmark-completed-task.spec.ts(3 tests)progress-updates-on-task-completion.spec.ts(4 tests)filter-active-tasks.spec.ts(3 tests)Error:
TypeError: (0 , _components.taskCompletionCheckboxRoleData) is not a functionLikely cause: The helper function
taskCompletionCheckboxRoleDatais being imported and used but is not exported or defined in the components index.2. Test timeout + disabled button (1 flaky failure)
edit-task-text.spec.ts: "multiple tasks can be edited independently"- Error: Test timeout of 30000ms exceeded waiting for "Add task" button to be enabled
- Likely cause: The button remained disabled during form interaction, preventing task submission
Sixteen failures. Two root causes. The first tells you where to look: the components index file is missing an export. The second flags a flaky test with the specific button and timeout. This lands as a comment on the PR:
The whole analysis: $0.05. Time: 134 seconds, most of it the tests running.
Shaping the Output
The prompt is the most interesting lever. Change it, and you change what the agent does for you.
The workflow above uses the simplest mode: run the tests, tell me what broke. But you can push it further.
Group by root cause. When multiple tests fail, they're often symptoms of the same problem. A missing API mock breaks five specs. A changed component name breaks three. Ask the model to cluster failures instead of listing them flat:
prompt: |
  Run the test suite: npm run test:e2e
  If tests fail, group the failures by likely root cause.
  For each group:
  - Describe the probable root cause
  - List the affected spec files
  - Quote the key error message
  If a single change could fix multiple failures, say so.
  Do not modify any files.
Instead of "here are seven failures," you get "these seven failures have two root causes: a missing mock for the /api/users endpoint (5 specs) and a renamed CSS class on the sidebar (2 specs)."
Separate your failures from pre-existing ones. On repos where a few flaky tests are always red, the real question isn't "what failed?" but "what failed that wasn't already failing?" This prompt reads the PR diff and makes the call:
prompt: |
  Run the test suite: npm run test:e2e
  If tests fail:
  - Read the PR diff to understand what changed in this PR
  - For each failing test, assess whether the failure is likely
    caused by changes in this PR or was pre-existing
  - Clearly separate "new failures likely from this PR" vs
    "pre-existing / unrelated failures"
  Do not modify any files.
Suggest fixes. You can ask the model to read the source code around failing tests and describe what it would change, without applying anything:
prompt: |
  Run the test suite: npm run test:e2e
  If tests fail:
  - Summarize each failure
  - Read the relevant source files and test files
  - For each failure, suggest a specific fix
    (which file, which line, what to change)
  Do not modify any files. Only describe the fixes.
Instead of starting from "something failed in checkout-flow.spec.ts," you start from "line 47 references Pay now but the button text was changed to Complete purchase in Button.tsx:23." You still make the call.
A note on the last two modes: they're more ambitious than plain summarization. The regression check asks the model to correlate diffs with failures. The fix suggestions ask it to read source code and reason about repairs. Both work well in my experience, but they're doing more than reading comprehension. Treat their output as a starting point, not a verdict.
The Cost
Haiku pricing as of early 2026:
- Input: $1 per million tokens
- Output: $5 per million tokens
The run above used about 35,000 input tokens. Total API cost: $0.05. A run with three failures and shorter output comes in under a penny. The --max-turns flag is the main cost control. It caps how much work the agent does.
There's also GitHub Actions compute. A 10-minute run on an ubuntu runner costs about $0.08 in GHA minutes. If this workflow runs alongside your existing CI rather than replacing the test step in it, you're running tests twice. For teams watching CI budgets, consider replacing your existing test step with this one, or triggering this workflow only when your primary CI reports failures.
What the Agent Can and Can't Do
The workflow runs in CI. It checks out your code into a temporary runner. The agent works on that copy. It can't push to your repository, can't access your local machine, and the runner gets destroyed after the job finishes.
Blocking write tools is a choice, not a requirement. A more ambitious workflow could run tests, summarize failures, attempt a fix on the checked-out copy, and push a fix branch. Adjust the allowedTools and disallowedTools lists to match. Start with read-only. Expand it when the analysis proves useful.
A few security notes:
- Fork PRs are skipped. Forks don't have access to repository secrets, so the
ifcondition skips the Claude step. Do not change the trigger topull_request_target. That gives fork PRs access to your secrets. - The agent can read any file in the checkout. If your repo contains config files with internal URLs or
.env.examplefiles with sensitive patterns, the agent could include that information in the PR comment. On public repos, PR comments are public. - The
allowedToolsglob is a guardrail, not a security boundary.Bash(npm run test:e2e*)uses a wildcard that's best-effort pattern matching. It's sufficient for guiding the model, but don't rely on it as an access control mechanism.
This Works With Any Test Framework
I'm showing Playwright because that's what I run. But nothing here is Playwright-specific. Swap npm run test:e2e for whatever your team uses:
pytestfor Pythonmvn testfor Java/Mavengo test ./...for Gobundle exec rspecfor Ruby/Railsdotnet testfor .NET
The model parses any test output format and extracts failure patterns. It knows what a JUnit stack trace looks like. It knows what a pytest traceback looks like. The allowedTools list adjusts to match:
# For a Python project:
claude_args: |
  --model haiku
  --max-turns 6
  --allowedTools "Bash(pytest*)"
  --allowedTools "Bash(python -m pytest*)"
  --allowedTools "Read"
  --allowedTools "Glob"
  --allowedTools "Grep"
  --disallowedTools "Edit"
  --disallowedTools "Write"
Same idea. Different test command.
What This Won't Do
This is a triage layer. It reads test output and gives you a breakdown. That's the scope.
It won't always get the root cause right. Sometimes it'll nail it, like spotting a missing export from a TypeError. Sometimes it'll describe the symptom without finding the cause. Run it twice on the same log and you might get slightly different groupings. It's non-deterministic, like all LLM output.
It doesn't track failure patterns over time. It doesn't manage test cases or measure coverage. And if your test output is enormous (hundreds of failures with verbose stack traces), the quality may degrade as you approach the model's context window.
It's a starting point. You read the report, go to the right file, and fix the problem. The value is in the minutes you didn't spend scrolling through logs to find the three lines that matter.
Getting Started
You need two things:
-
An Anthropic API key. Sign up at console.anthropic.com. Add it as a repository secret called
ANTHROPIC_API_KEY(Settings → Secrets and variables → Actions). -
The workflow file. Copy the YAML above into
.github/workflows/test-analyzer.yml. Change the test command in both thepromptand theallowedToolsto match your project.
That's it. Your test suite runs as before. When something fails, the analysis shows up on the PR instead of buried in logs.
To verify it works, push a PR with a deliberately broken test. The analysis should appear as a comment within a few minutes. If the comment doesn't appear, check the Claude step's output in the Actions tab. That's where errors surface.
If you've read Part 1 and Part 2 of this series, the thread is the same: AI in testing is a cost problem. Part 1 made the case for code generation over vision. Part 2 showed how to give agents context through component documentation. This post adds another piece: your CI already has the answers buried in its logs. Let AI read them so you don't have to. I'm still discovering what else is needed. More on that as I find it.
P.S. I help teams set up AI-driven test automation, from failure analysis like this to full test generation pipelines. Available for consulting → imagineers.dev
Enjoyed this article?
Get in touch to discuss how AI-powered testing can transform your QA processes.