Agentic Memory for CI: When Your Pipeline Remembers
Running Playwright tests with an LLM gives you per-run analytics. But how do you track patterns across runs and build a full test analytics platform with LLMs?

Krishnanand B
February 18, 2026
You can wire an LLM into your CI pipeline and have it run your Playwright tests, analyze the failures, and figure out which ones share a root cause. We built this in Part 3 of this series: sixteen failures, two root causes, five cents.
That's useful, but it's per-run. Each analysis starts fresh. The agent has no idea that checkout-flow.spec.ts failed four of the last five runs, or that the same TypeError keeps coming back every time someone refactors the components directory, or that last week's timeout had the same fix as this week's. Every run is an island.
The question that follows naturally: how do you expand this into a full test analytics platform? One that tracks patterns across runs, remembers what broke before, and knows what fixed it?
Cloud testing platforms like BrowserStack Test Reporting & Analytics and LambdaTest Test Analytics offer this. So do observability tools like Datadog CI Visibility and specialized runners like Buildkite Test Analytics. But QA analytics is typically the last thing to get engineering attention. It sits behind feature work, infrastructure, and a dozen other priorities. Teams end up managing pattern detection manually, or not at all.
There's a simpler approach. The CI pipeline is already running the tests and analyzing the output. Give it a memory that persists between runs, and it can track the patterns itself. No external tooling, no integration work. In the AI agent world, this concept is called agentic memory.
What is Agentic Memory?
Google's research on context engineering (Milam and Gulli, 2025) draws a useful line between two kinds of context an agent can work with. Session context is what the agent sees during a single invocation: the current log, the current PR, the current prompt. When the session ends, that context is gone. This is what Part 3 built.
Memory is context that survives across sessions. The agent starts a new run and already knows something about the project's history.
Two types of memory matter here:
Declarative memory holds facts about past events. "Test X failed four of the last five runs." "Checkout tests started breaking after PR #247." "The payment timeout correlates with changes to the form component." This is what happened.
Procedural memory holds patterns for solving problems. "When TypeError: X is not a function appears in the task specs, check the components index for a missing export." "Timeout on the payment button usually means the API mock didn't load." This is what to do about it.
The challenge with both types: if you store everything in one place, it becomes noise. A flat list of past failures grows to hundreds of entries after a few weeks. Flaky tests mixed with real bugs mixed with environment issues. The agent reads them all, can't tell which is which, and the useful signal gets buried.
OpenClaw, an open-source agent framework, offers a pattern for solving this. Every OpenClaw agent gets a workspace: a folder of markdown files, each with a specific purpose. IDENTITY.md defines the agent's role and behavior. MEMORY.md holds accumulated knowledge. Different concerns live in different files, and the agent reads them all before starting work. The key idea: separate memory by concern, and give each concern its own identity.
A Memory Workspace for Tests
This pattern maps directly to CI test analysis. Instead of one file that mixes flaky timeouts with real bugs with environment issues, you create a workspace where each folder holds one category of test intelligence. Each folder gets an IDENTITY.md that tells the agent what this category is, how to recognize it, and what to do with it.
Here's the structure:
.ci/memory/
├── IDENTITY.md
├── flakiness/
│   ├── IDENTITY.md
│   └── MEMORY.md
├── real-failures/
│   ├── IDENTITY.md
│   └── MEMORY.md
├── resolutions/
│   ├── IDENTITY.md
│   └── MEMORY.md
└── runs/
    └── 2026-02-15.md
The root IDENTITY.md is the agent's operating manual. It explains the workspace layout and how to route new findings:
# Test Memory Workspace

You are a CI test analyst. Before analyzing the current run, read
the memory files below to understand this project's test history.

## Workspace Layout
- flakiness/: Tests that fail intermittently. Check here first for
  known flaky patterns before reporting a failure as new.
- real-failures/: Genuine bugs caught by tests. Failures that
  reproduce consistently and point to actual code defects.
- resolutions/: Known fixes for recurring problems. When you see a
  familiar error, check here for what worked last time.
- runs/: Per-day logs of raw run outcomes.

## Your Job
1. Read the IDENTITY.md and MEMORY.md in each subfolder.
2. Run the tests.
3. Classify each failure: is it a known flaky pattern, a real bug,
   or something new?
4. Update the appropriate MEMORY.md file with new findings.
5. Write today's run log to runs/YYYY-MM-DD.md.
Each subfolder's IDENTITY.md defines what belongs there: criteria for classifying a test as flaky, what counts as a real failure, what qualifies as a known fix. The agent reads these before analyzing the current run, so it knows where to route each finding.
The matching MEMORY.md files accumulate findings over time. Here's what the flakiness file looks like after a few runs:
# Known Flaky Tests

## checkout-flow.spec.ts: Payment Button Timeout
- Frequency: 3 of last 10 runs
- Error: Timeout waiting for `[aria-label="Pay now"]` button
- Pattern: Fails when CI runner has high load. Passes on retry.
- Correlation: More frequent on Monday mornings (after weekend
  staging DB maintenance)
- Recommendation: Add a retry or increase timeout for this locator

## search.spec.ts: Filter Dropdown
- Frequency: 2 of last 8 runs
- Error: Element not found: `[data-testid="filter-dropdown"]`
- Pattern: Race condition. Dropdown renders after assertion runs.
- Recommendation: Wait for dropdown visibility before asserting
The real-failures/ and resolutions/ folders follow the same pattern. Their identity files define what belongs there. Their memory files accumulate knowledge.
This works because the identity files give the agent judgment. The folder structure forces classification instead of dumping everything in one pile:
- A timeout that disappears on retry →
flakiness/ - A TypeError that reproduces on every run →
real-failures/ - A known fix for that TypeError →
resolutions/
Why markdown and why a repo?
- Markdown because your team can open
flakiness/MEMORY.mdin a PR review and read it like a document. No parser needed. - A repo because it's versioned. Every memory update shows up in the diff. The team can correct or prune what the agent learned. No external service, no database.
One design constraint: keep each
MEMORY.mdfile under 4,000 tokens. Context windows are finite. If flakiness memory grows past that, archive older entries into a separate file or drop the lowest-frequency patterns. Prune on every write.
The Workflow: Memory-Aware Test Analysis
This builds on Part 3. You'll need a working claude-code-action setup, an Anthropic API key, and a Playwright test suite.
Here's where this is headed. After a few runs, the agent writes entries like this into the memory workspace:
checkout-flow.spec.ts: Timeout on Pay now button. 3 of last 10 runs. Fails under high CI runner load, more frequent Monday mornings after staging DB maintenance. FLAKY.
TypeError: taskCompletionCheckboxRoleData is not a function: Missing export in components/index.ts. Appeared Feb 12, re-introduced Feb 16. See resolutions/ for known fix.
The agent reads these before analyzing the current failure, classifies what it finds, and writes new findings back. Here's the GitHub Actions workflow that makes it happen.
name: E2E Test Analyzer with Memory

on:
  pull_request:

permissions:
  contents: write
  pull-requests: write

concurrency:
  group: test-analysis-${{ github.event.pull_request.number }}
  cancel-in-progress: true

jobs:
  test-analysis:
    if: >-
      github.event.pull_request.head.repo.full_name == github.repository
    runs-on: ubuntu-latest
    timeout-minutes: 30
    steps:
      - name: Checkout
        uses: actions/checkout@v4
        with:
          ref: ${{ github.event.pull_request.head.sha }}
          fetch-depth: 1

      - name: Setup Node
        uses: actions/setup-node@v4
        with:
          node-version: 20
          cache: npm

      - name: Install Dependencies
        run: npm ci

      - name: Install Playwright Browsers
        run: npx playwright install --with-deps chromium

      - name: Bootstrap Memory Workspace
        run: |
          mkdir -p .ci/memory/flakiness
          mkdir -p .ci/memory/real-failures
          mkdir -p .ci/memory/resolutions
          mkdir -p .ci/memory/runs

          # Only create identity files if they don't exist yet.
          # Once committed, they persist across runs.
          if [ ! -f .ci/memory/IDENTITY.md ]; then
            echo "First run: memory workspace will be created by the agent."
          fi

      - name: Run Tests via Claude Code
        id: claude
        continue-on-error: true
        uses: anthropics/claude-code-action@v1
        with:
          anthropic_api_key: ${{ secrets.ANTHROPIC_API_KEY }}
          github_token: ${{ github.token }}
          prompt: |
            You are a CI test analyst with a persistent memory workspace.

            IMPORTANT: Be efficient with your turns. Read multiple files
            in a single turn by making parallel tool calls. Write multiple
            files in a single turn the same way.

            STEP 1: Read ALL memory files in ONE turn.
            Read these files in parallel (all at once, in one turn):
            - .ci/memory/IDENTITY.md
            - .ci/memory/flakiness/IDENTITY.md
            - .ci/memory/flakiness/MEMORY.md
            - .ci/memory/real-failures/IDENTITY.md
            - .ci/memory/real-failures/MEMORY.md
            - .ci/memory/resolutions/IDENTITY.md
            - .ci/memory/resolutions/MEMORY.md
            Also glob .ci/memory/runs/*.md and read any that exist.
            If the files don't exist yet (first run), create them
            using the workspace structure described in IDENTITY.md
            before proceeding to Step 2.

            STEP 2: Run the test suite.
            Execute: npm run test:e2e

            STEP 3: Classify each failure and write ALL updates in ONE turn.
            For each failing test, classify it:
            - Known flaky pattern? Note it, don't treat as new bug.
            - Genuine failure? Add to real-failures/MEMORY.md.
            - Has a known fix? Reference resolutions/MEMORY.md.
            - Looks intermittent? Add to flakiness/MEMORY.md.
            - Can identify the fix? Add to resolutions/MEMORY.md.
            Write ALL updated memory files AND today's run log
            (.ci/memory/runs/YYYY-MM-DD.md) in a SINGLE turn using
            parallel Write calls.
            The run log should include: total tests, passed, failed,
            flaky, and a one-line note per failure.

            STEP 4: Post your analysis as your final text response.
            Summarize:
            - New failures (not seen before)
            - Recurring failures (with history from memory)
            - Known flaky tests (with frequency)
            - Suggested fixes (from resolutions memory)

            Do not modify any source or test files.
          claude_args: |
            --model haiku
            --max-turns 16
            --allowedTools "Bash(npm run test:e2e)"
            --allowedTools "Bash(npm run test:e2e*)"
            --allowedTools "Bash(npx playwright test*)"
            --allowedTools "Bash(node -v)"
            --allowedTools "Bash(npm -v)"
            --allowedTools "Read"
            --allowedTools "Write"
            --allowedTools "Glob"
            --allowedTools "Grep"
            --disallowedTools "Edit"
            --disallowedTools "Replace"
            --disallowedTools "NotebookEditCell"

      - name: Commit Memory Updates
        if: >-
          !cancelled() &&
          steps.claude.outcome != 'skipped'
        run: |
          git config user.name "github-actions[bot]"
          git config user.email "github-actions[bot]@users.noreply.github.com"

          git add .ci/memory/
          if git diff --cached --quiet; then
            echo "No memory changes to commit."
          else
            git commit -m "ci: update test memory workspace"
            git push origin HEAD:${{ github.head_ref }}
          fi

      - name: Post Test Summary to PR
        if: >-
          !cancelled() &&
          steps.claude.outputs.execution_file
        env:
          GH_TOKEN: ${{ github.token }}
          EXEC_FILE: ${{ steps.claude.outputs.execution_file }}
          PR_NUMBER: ${{ github.event.pull_request.number }}
        run: |
          if [ ! -f "$EXEC_FILE" ]; then
            echo "No execution file found, skipping PR comment."
            exit 0
          fi

          jq -r '
            [.[] | select(.type == "result")]
            | last | .result // empty
          ' "$EXEC_FILE" > /tmp/test-summary.md

          if [ -s /tmp/test-summary.md ]; then
            gh pr comment "$PR_NUMBER" \
              --body-file /tmp/test-summary.md
          fi
Here's what changed from Part 3.
Permissions and bootstrap. contents: write is new because the workflow commits memory updates back to the branch. The bootstrap step creates the folder structure on first run; after that, the folders persist via git.
The prompt has four steps now. Read all memory in one turn (parallel reads), run tests, classify and write all updates in one turn (parallel writes), then post the summary. Parallel batching matters here. Without it, files get read one at a time and the turn budget runs out early. The classification step is the key difference from Part 3: instead of treating every failure the same way, each one gets checked against the workspace. Known flaky? Flag it but don't panic. Known fix? Suggest it. New failure? Investigate and record it.
Identity files get created on the first run. If the workspace is empty, the prompt tells the analyzer to create the structure. After that first commit, the files persist. You can (and should) edit them. Tune the flakiness criteria. Add project-specific patterns to resolutions. These files are instructions, not sacred text.
--max-turns goes from 6 to 16 because the workflow now reads memory, runs tests, classifies failures, writes updates, and logs the run. The prompt batches parallel reads and writes into single turns to stay within budget.
The commit step stages everything with git add .ci/memory/ and pushes. No merge logic needed.
After a few runs, the workspace fills up. Here's what each file looks like in practice.
flakiness/MEMORY.md (the agent wrote this across three runs):
# Known Flaky Tests

## checkout-flow.spec.ts: Payment Button Timeout
- Frequency: 3 of last 10 runs
- Error: Timeout waiting for `[aria-label="Pay now"]` button
- Pattern: Fails under high CI runner load. Passes on retry.
- Correlation: More frequent on Monday mornings after staging
  DB maintenance runs overnight.
- Recommendation: Increase timeout for this locator from 5s to 15s

## search.spec.ts: Filter Dropdown Not Found
- Frequency: 2 of last 8 runs
- Error: Element not found: `[data-testid="filter-dropdown"]`
- Pattern: Race condition. Dropdown renders after assertion fires.
- Recommendation: Add waitForSelector before the assertion
resolutions/MEMORY.md:
# Known Fixes

## TypeError: taskCompletionCheckboxRoleData is not a function
- Affected tests: checkout-flow, unmark-completed-task,
  progress-updates, filter-active-tasks
- Root cause: Missing export in components/index.ts
- Fix: Add `export { taskCompletionCheckboxRoleData }` to
  components/index.ts
- Occurrences: Feb 12, Feb 16 (re-introduced by a refactor)

## Timeout on "Add task" button
- Affected tests: edit-task-text.spec.ts
- Root cause: Button stays disabled when form validation fails
  silently
- Fix: Check that the input field has a non-empty value before
  waiting for the button
- Occurrences: Feb 14
runs/2026-02-16.md:
# Test Run: 2026-02-16

- Total: 34 | Passed: 17 | Failed: 16 | Flaky: 1
- PR: #287
- Duration: 2m 14s

## Failures
- checkout-flow.spec.ts (5 tests): TypeError,
  taskCompletionCheckboxRoleData not a function. RECURRING.
  See resolutions/ for known fix.
- unmark-completed-task.spec.ts (3 tests): Same TypeError.
- progress-updates.spec.ts (4 tests): Same TypeError.
- filter-active-tasks.spec.ts (3 tests): Same TypeError.
- edit-task-text.spec.ts (1 test): Timeout on "Add task"
  button. FLAKY. See flakiness/ for pattern.
Notice how the run log references the other memory files. "See resolutions/ for known fix" means the analyzer matched the current error against a past fix. "RECURRING" and "FLAKY" are classifications it made by reading the workspace before looking at the current run.
Not guessing at the fix. Remembering it. And knowing what kind of failure you're looking at before you start diagnosing.
What Changes When CI Remembers
Automatic classification. The PR comment becomes triage, not a dump:
- A timeout that passed on the previous run → flaky
- A TypeError that appeared twice before with a known fix → recurring
- A brand-new assertion error → worth investigating
The workspace forces this categorization on every run.
Pattern matching across runs. When a test fails and the error signature matches something in resolutions/MEMORY.md, the analysis can reference the past fix. "This TypeError appeared on Feb 12 and Feb 16. Both times the fix was re-adding the export to components/index.ts." Instead of re-diagnosing, you start from a known answer.
Trend detection. The flakiness/ folder is a running record of intermittent failures. After ten runs, there's enough data to say: "checkout-flow.spec.ts has failed 3 of the last 10 runs on Monday mornings. This correlates with the staging DB maintenance window." That kind of insight takes a human weeks of casually noticing. The memory file surfaces it on every run.
The Analytics Dashboard
PR comments are useful for the developer looking at a specific failure. But the memory workspace holds a bigger picture: trends across weeks, flakiness patterns across the whole suite, resolution coverage gaps. That data is worth surfacing somewhere the whole team can see it.
The claude-code-action only supports pull request events. Analytics generation belongs on main, after memory has been merged. Add a separate job that uses the Claude Code CLI directly:
  analytics:
    needs: playwright
    if: >-
      !cancelled() &&
      github.ref == 'refs/heads/main' &&
      needs.playwright.result != 'skipped'
    runs-on: ubuntu-latest
    timeout-minutes: 10
    environment:
      name: github-pages
      url: ${{ steps.deployment.outputs.page_url }}
    steps:
      - uses: actions/checkout@v4

      - name: Check Memory Workspace
        id: memory
        run: |
          if [ -f .ci/memory/IDENTITY.md ]; then
            echo "exists=true" >> "$GITHUB_OUTPUT"
          else
            echo "exists=false" >> "$GITHUB_OUTPUT"
          fi

      - uses: actions/setup-node@v4
        if: steps.memory.outputs.exists == 'true'
        with:
          node-version: 20

      - name: Generate Analytics Report
        if: steps.memory.outputs.exists == 'true'
        env:
          ANTHROPIC_API_KEY: ${{ secrets.ANTHROPIC_API_KEY }}
        run: |
          mkdir -p .ci/report
          npx -y @anthropic-ai/claude-code -p "
            Read .ci/memory/ and generate a self-contained
            HTML dashboard at .ci/report/index.html.
            Dark theme, responsive, no external deps.
            Sections: overview cards, run history chart,
            flakiness leaderboard, real failures table,
            resolution knowledge base, memory health.
          " \
            --model haiku \
            --max-turns 6 \
            --allowedTools "Read" \
            --allowedTools "Write" \
            --allowedTools "Glob" \
            --allowedTools "Grep" \
            --disallowedTools "Bash" \
            --disallowedTools "Edit"

      - name: Upload Pages Artifact
        if: steps.memory.outputs.exists == 'true'
        uses: actions/upload-pages-artifact@v3
        with:
          path: .ci/report/

      - name: Deploy to GitHub Pages
        if: steps.memory.outputs.exists == 'true'
        id: deployment
        uses: actions/deploy-pages@v4
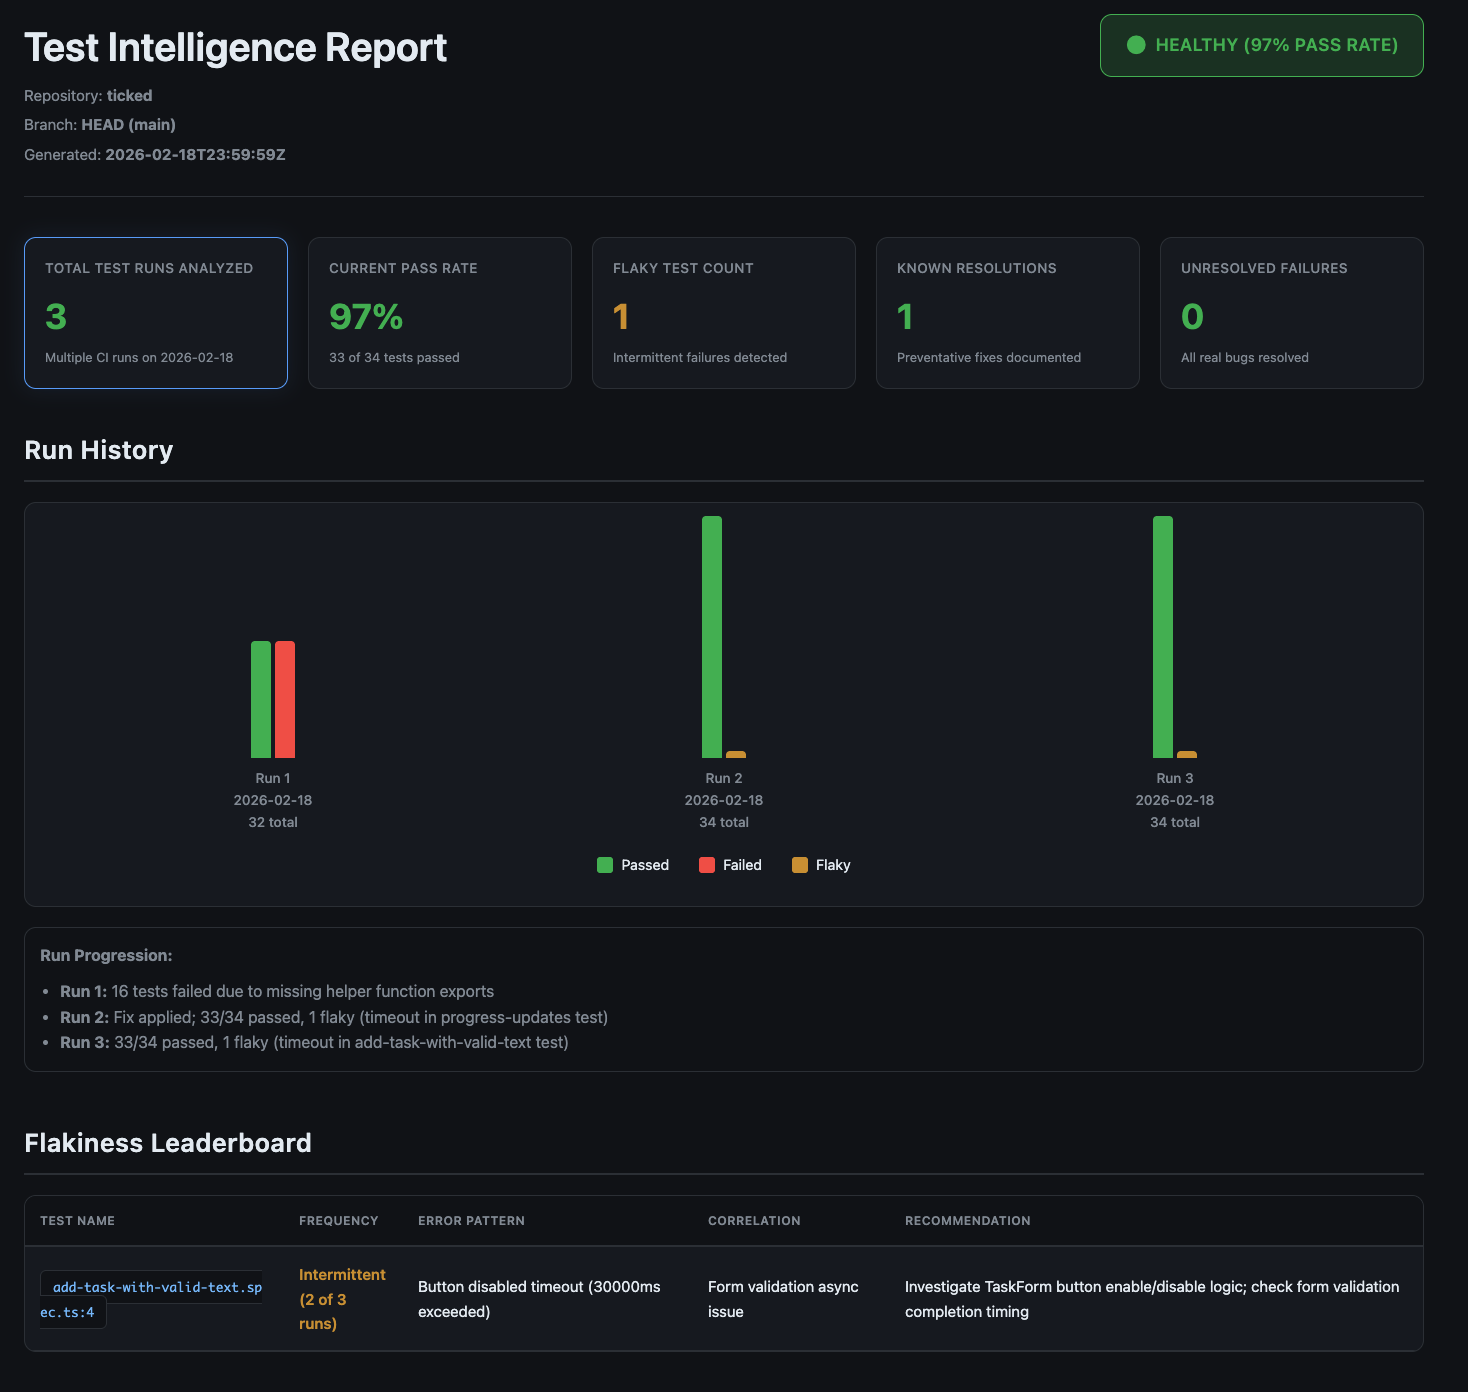
The flow works like this: PRs update memory files, the merge commits them to main, and the analytics job picks them up on the next main push. Each time the memory workspace grows, the dashboard gets richer. Once ten runs accumulate, you have:
- A flakiness leaderboard with real frequency data
- A knowledge base of known fixes
- A run history chart showing whether your test suite is getting healthier or worse
Here's what the generated dashboard looks like after a few runs:
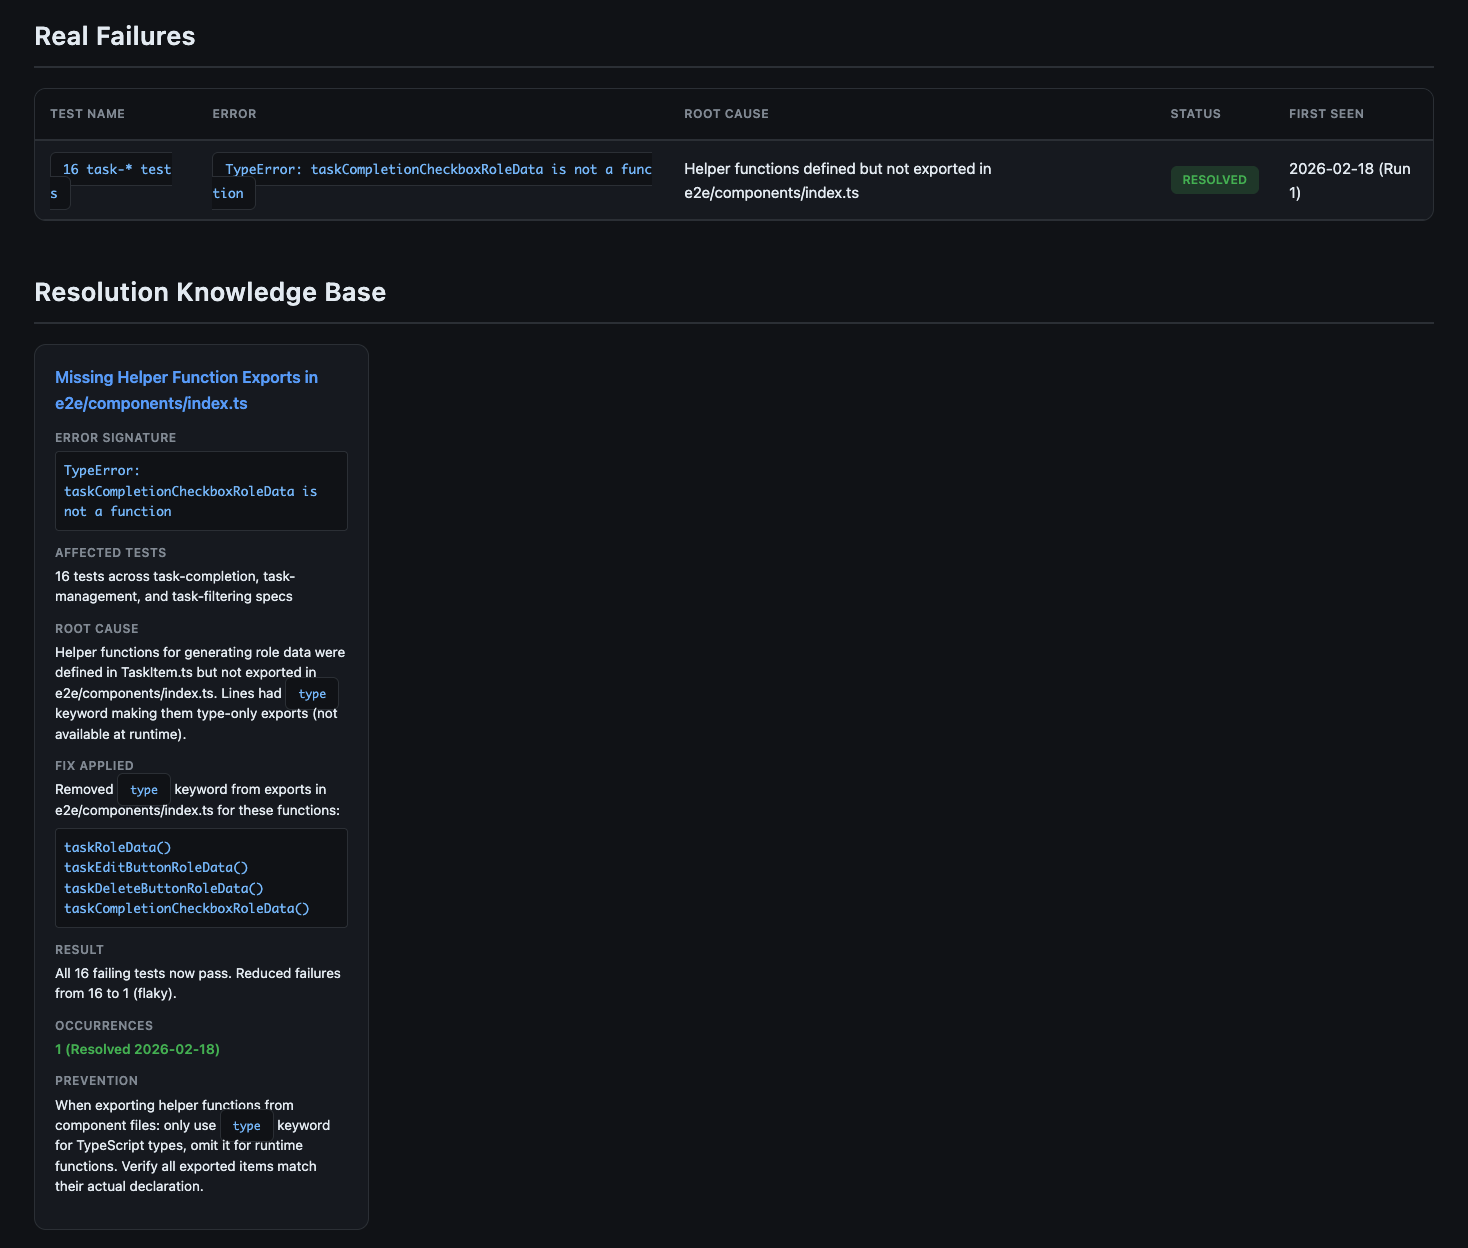
The real failures table and resolution knowledge base give the team a quick reference for known issues and their fixes:
The dashboard lives at https://<org>.github.io/<repo>/. No infrastructure. No SaaS. One HTML file generated from markdown files by the same agent that analyzed your tests. The layout may vary between runs since it's prompt-driven; provide a template in the prompt if you need a consistent structure.
What This Won't Do (Yet)
- Memory quality depends on extraction quality. If the workspace fills with vague entries like "test failed," that's useless on the next read. The identity files help by specifying what to record (error signatures, frequencies, correlations), but you'll iterate on those instructions a few times before entries are consistently useful.
- The files grow. Each
MEMORY.mdneeds a size cap (I suggest 4,000 tokens per file). Without pruning, old patterns crowd out useful ones. Drop entries that haven't recurred in 30 days, archive resolved flaky tests, keep the resolutions file lean. - Classification isn't perfect. A genuine bug might end up in the flakiness folder. A known fix might get missed. Review the memory diffs in PRs and correct misclassifications by editing the files directly; the workspace is designed to be human-editable.
- Still read-only. Same constraint as Part 3: analysis, not automated repair. The agent suggests. You make the call.
- Concurrent PRs can conflict. The per-PR concurrency group prevents re-runs on the same PR, but parallel PRs both read and write the shared memory files. A merge queue or sequential workflow solves this but adds complexity.
- Cost stays low. Reading memory files adds a fraction of a cent per run at Haiku's pricing. Total cost stays under fifteen cents, most of it the test execution itself.
This is not a product. It's a pattern. It needs maintenance: identity file tuning, retention policies, occasional cleanup. If you want hands-off, this isn't it. If you want a starting point that your team can shape, it is.
The Series So Far
Part 1 made the case that code generation beats vision models for test automation at scale. Part 2 showed how to give agents context through structured component docs. Part 3 wired an agent into CI to analyze test failures per run, for five cents. This post adds persistence across runs.
Pick your worst flaky test. The one your team jokes about. Set up the memory workspace, let it run for a week, and read what accumulates in flakiness/MEMORY.md. You'll see patterns you missed, and Monday morning will feel different when the pipeline already knows what broke and why.
Enjoyed this article?
Get in touch to discuss how AI-powered testing can transform your QA processes.